Consumption
Electricity consumption
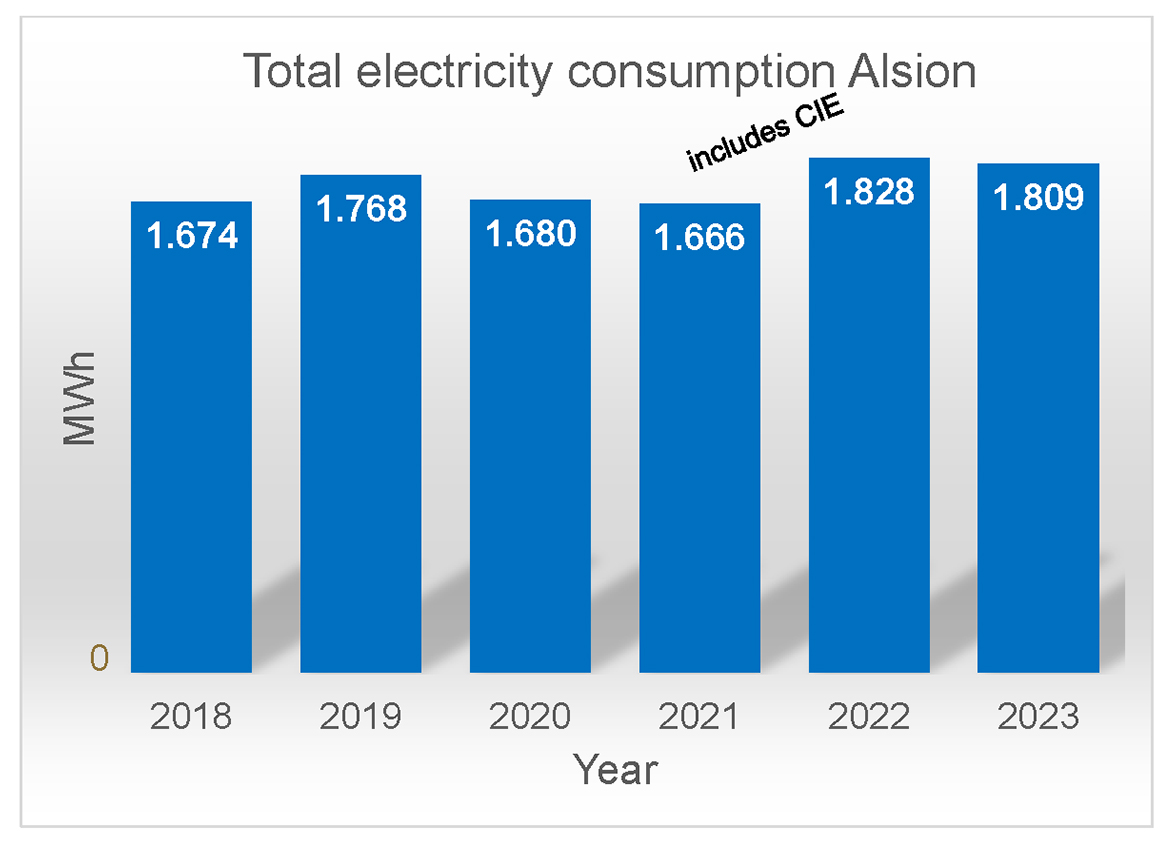
Our first graph shows the overall electricity consumption in the whole building since 2018, including the CIE, which was built in 2017 and fully running in 2021. The year 2018 serves as a reference for SDU’s climate plan in general. Only interrupted by the time of lock downs due to Corona, the total electricity consumption has the tendency to increase. because of the new CIE building and increasing activities in the labs.
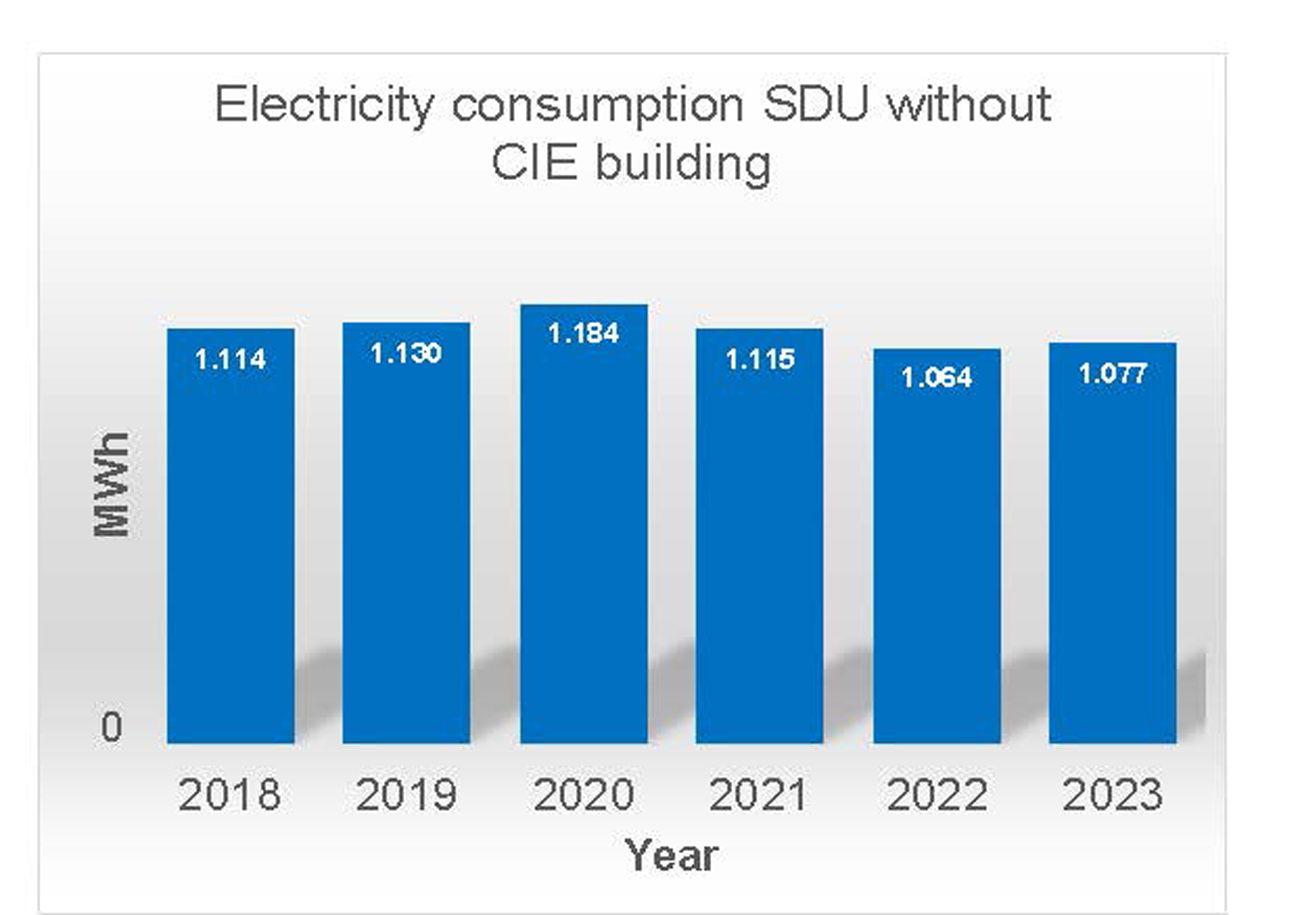
Without the new CIE building, we see a decline in the consumption of electricity. The saving is due to a continuous exchange of lightning, exchange of projectors to screens in the lecture halls and in part the shift to new heating and cooling installations for some labs. The outdoor lightning was changed to LED in 2024 and consumes now roughly half of what it used to be.
For 2025, we expect more savings as installation pumps for water use and heating were exchanged.
Water consumption
Overall consumption
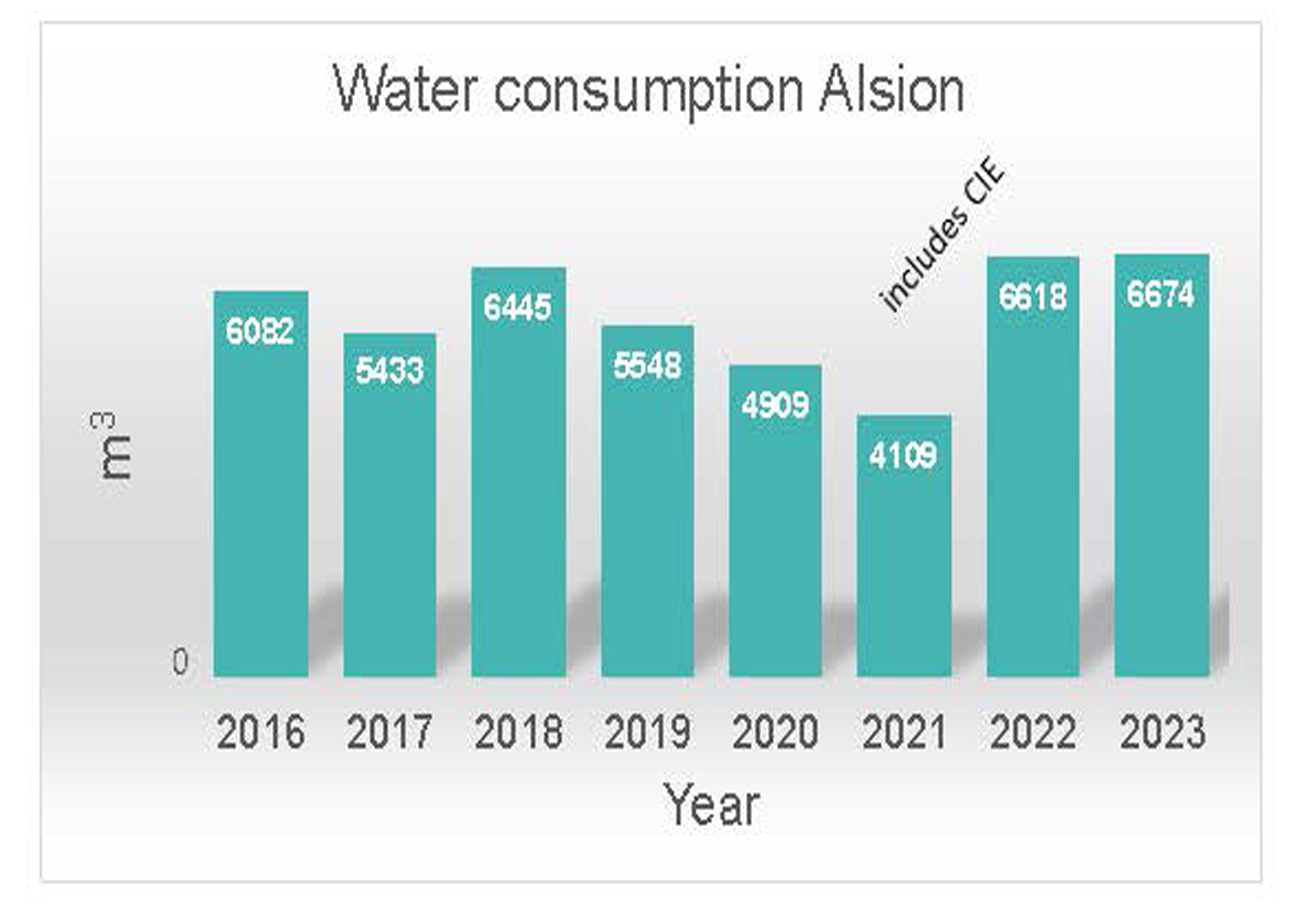
The water consumption increases with the activity level and the rising numbers of people at Alsion. The increase in water consumption from 2017 to 2018 is the result of the construction of the new CIE building, when all water supply came from Alsion.
Heat consumption
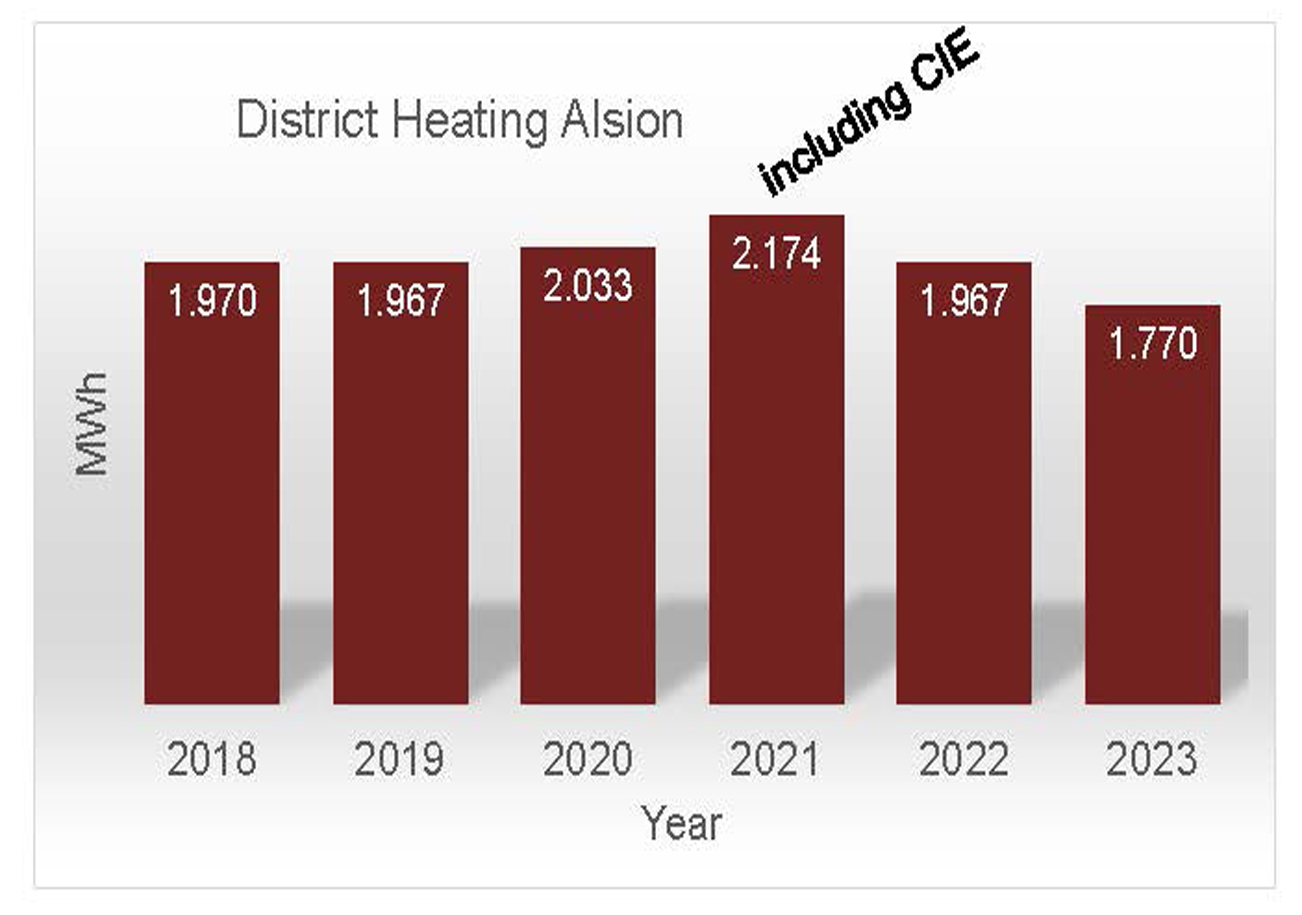
The consumption of district heating went considerably down in 2022/2023 due to the overall strategy to save energy and reduce the temperature in public buildings to 19-20 degrees Celsius.
For information, please feel free to contact: Katharina Rubahn, briant@alsion.dk, Kerstin Fischer